CDMA signal using python
CDMA signal using python
 BPSK CDMA Signal
# Author : Jay Patel
# CDMA using Python

import random
import numpy as np
%matplotlib inline
from numpy import sin, pi

from matplotlib import rcParams
import matplotlib.pylab as plt
rcParams.update({'font.size': 12})
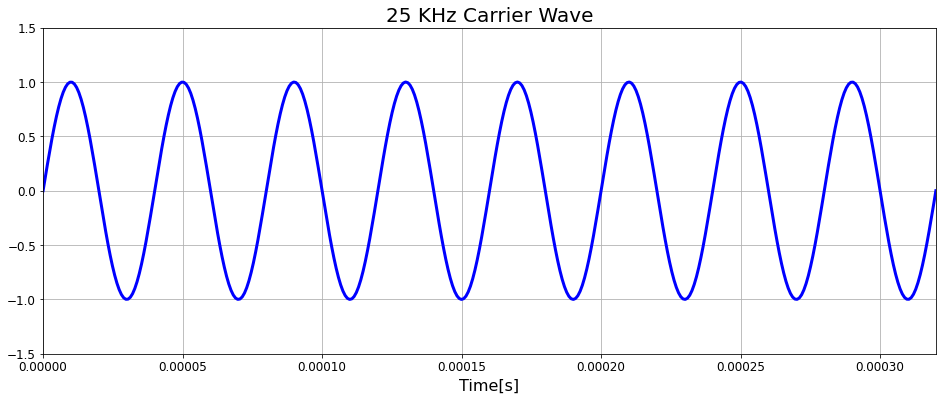
f = 25000
t=np.linspace(0,8/f,400)

carrier = lambda t: sin(2*pi*f*t)
plt.figure(figsize=(16,6))
plt.plot(t,carrier(t),'b', lw=3)
plt.title('25 KHz Carrier Wave',size=20)
plt.xlim([0,t[-1]])
plt.ylim([-1.5,1.5])
plt.xlabel('Time[s]',size='16')
plt.grid()
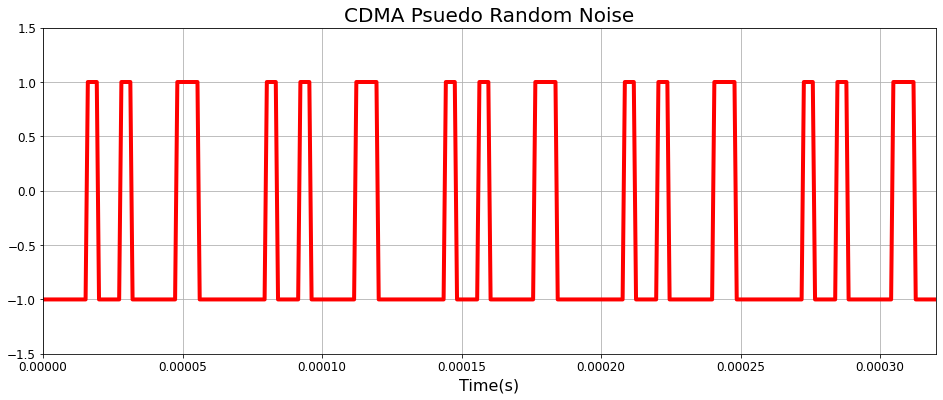
random.seed("GPS PRN")
prn_seq = [random.choice([1,-1]) for i in range(16)]

print("Our PRN chip:", str(prn_seq).replace('-1','0'))
Our PRN chip: [0, 0, 0, 0, 1, 0, 0, 1, 0, 0, 0, 0, 1, 1, 0, 0]
f_prn =  25e3 / 10
prn_seq[int(100*f_prn)%16]
-1
f_prn =  25e3 / .10
prn_seq[int(100*f_prn)%16]

def prn_np(t):
    return [ prn_seq[int(ti*f_prn)%16] for ti in t]
plt.figure(figsize=(16,6))
plt.plot(t,prn_np(t), color='red',lw=4)
plt.title('CDMA Psuedo Random Noise',size='20')
plt.xlim([0,t[-1]])
plt.ylim([-1.5,1.5])
plt.xlabel('Time(s)',size='16')
plt.grid()
np.size([ prn_seq[int(ti*f_prn)%16] for ti in t])
400
Binary Phase Shift Keying (BPSK)
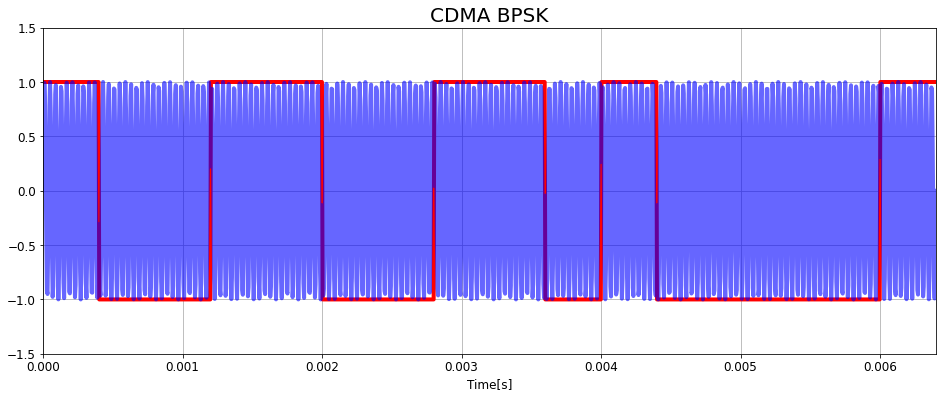
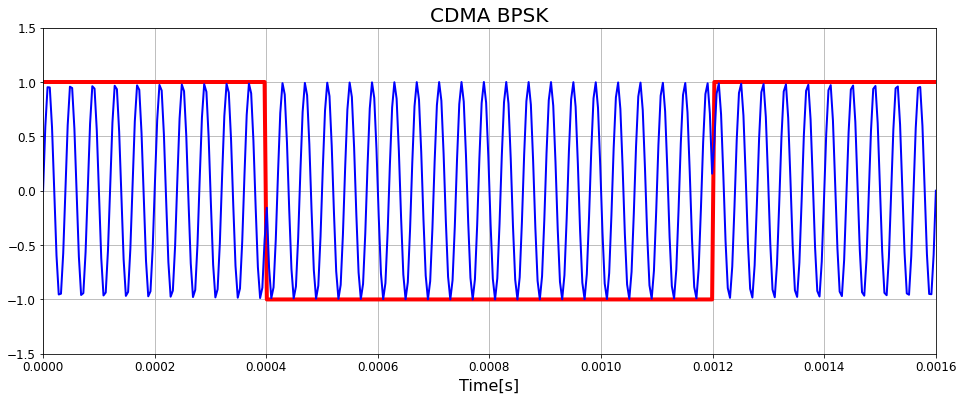
The transmited GPS signal uses binary phase shift keying, signal changed by shift $\pi=180^\circ$ while it turns from 1 to -1, which can be done by multiplying the carefully constructed PRN above with the carrier!
This works because a $\sin(x)\times(-1) = \sin(x-180^\circ)$, in other words it’s exactly a 180 degree phase shift. We should see this as blips in sine wave every time our data changes from 1 to 0 or visa-versa :
f = 25e3
f_prn =  25e3 /10

carrier = lambda t: sin(2*pi*f*t)
def prn_np(t):
    return [ prn_seq[int(ti*f_prn)%16] for ti in t]

#t=np.linspace(0,8/f_prn,400)
t=np.linspace(0,16/f_prn,1400)
signal = lambda t: carrier(t) * prn_np(t)
plt.figure(figsize=(16,6))
plt.plot(t,prn_np(t),color='red',lw=4)
plt.plot(t,signal(t),'b',lw=4,alpha=0.6)
plt.title('CDMA BPSK',size=20)
plt.xlim([0,t[-1]])
plt.ylim([-1.5,1.5])
plt.xlabel('Time[s]',size=12)
plt.grid()
#t=np.linspace(0,8/f_prn,400)
t=np.linspace(0,16/f_prn,1400)
signal = lambda t: carrier(t) * prn_np(t)
plt.figure(figsize=(16,6))
#plt.plot(t,prn_np(t),color='red',lw=4)
plt.plot(t,signal(t),'b',lw=4,alpha=0.6)
plt.title('CDMA BPSK',size=20)
plt.xlim([0,t[-1]])
plt.ylim([-1.5,1.5])
plt.xlabel('Time[s]',size=12)
plt.grid()
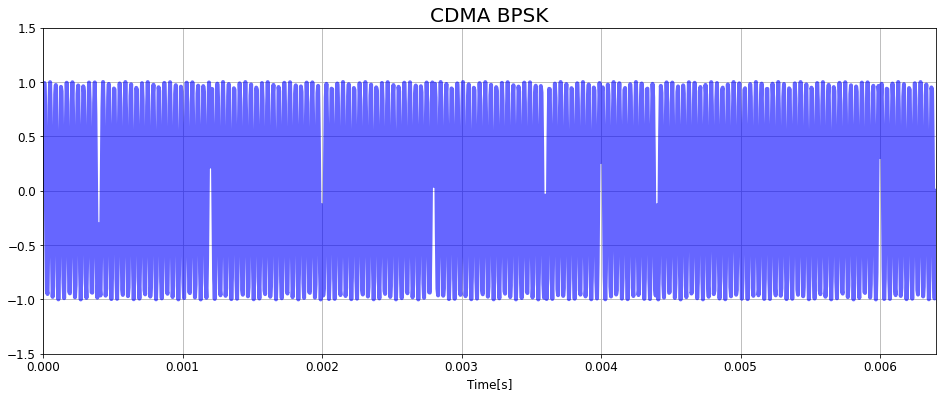
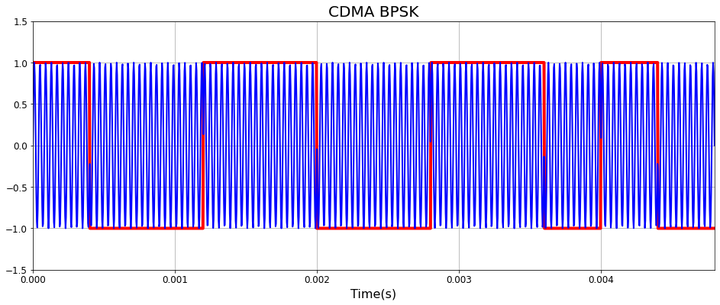
Too hard to be decipherable! The problem is that the carrier is running three orders of magnintude faster than the PRN!!! Unless we zoom into one spot where the phase shift happens we can see anything at this scale.
For the sake of argument lets make the prn modulation much faster.
f_prn =  25e3/10
t=np.linspace(0, 12/f_prn,1400)
signal = lambda t: carrier(t) * prn_np(t)
plt.figure(figsize=(16,6))
plt.plot(t,signal(t),'b',lw=2)
plt.title('CDMA BPSK',size=20)
plt.xlim([0,t[-1]])
plt.ylim([-1.5,1.5])
plt.grid()
plt.xlabel('Time(s)',size=16)
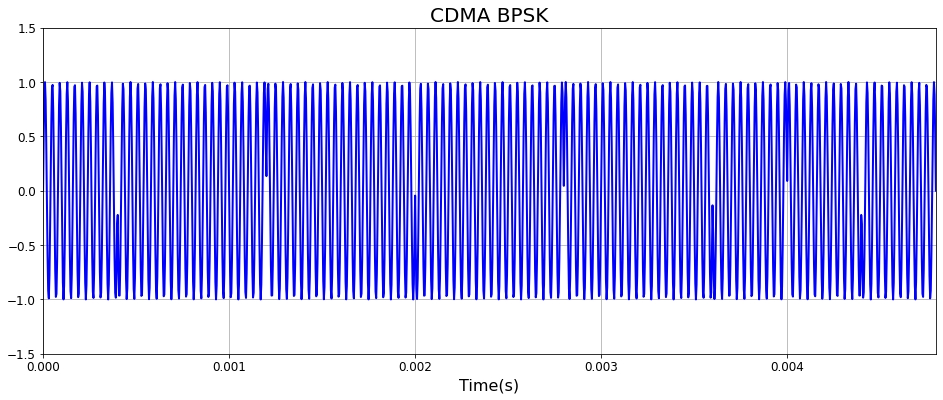
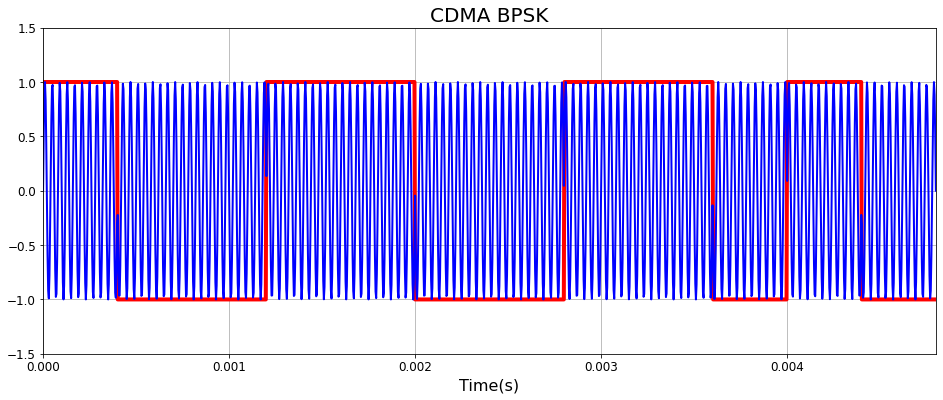
Now we see the phase shifts! To make what’s going on even clearer, lets overlay the PRN back on the chart to see how the phase shifts coincide with the edges of our PRN:
f_prn = f_prn =  25e3/10
t=np.linspace(0,12/f_prn,1400)

def prn_np(t):
    return [ prn_seq[int(ti*f_prn)%16] for ti in t]
plt.figure(figsize=(16,6))
plt.plot(t,prn_np(t),color='red',lw=4)
plt.plot(t,signal(t),'b',lw=2)
plt.title('CDMA BPSK',size=20)
plt.xlim([0,t[-1]])
plt.ylim([-1.5,1.5])
plt.grid()

plt.xlabel('Time(s)',size=16)
f_prn = f_prn =  25e3/10
t=np.linspace(0,12/f_prn,1400)

def prn_np(t):
    return [ prn_seq[int(ti*f_prn)%16] for ti in t]
plt.figure(figsize=(16,6))
plt.plot(t,prn_np(t),color='red',lw=4)
plt.plot(t,signal(t),'b',lw=2)
plt.title('CDMA BPSK',size=20)
plt.xlim([0,t[-1]])
plt.ylim([-1.5,1.5])
plt.grid()
#plt.text(0.15e-8,1.2,'-1,-1')
xt=t[-1]/16.
for i in np.arange(16):
    plt.text((i+1/2.)*xt,1.2,prn_seq[i])

plt.xlabel('Time(s)',size=16)

Exercise
- generate a sequence of codes with size 32 (PRN).
- generate the PRN BPSK graph.
- check the concideness between codes and graph.
prn_seq = [random.choice([1,-1]) for i in range(32)]
print(prn_seq)
[1, -1, -1, 1, 1, -1, -1, 1, 1, -1, 1, -1, -1, -1, -1, 1, 1, 1, -1, -1, -1, -1, -1, 1, 1, -1, 1, 1, -1, 1, 1, -1]
def prn_np(t):
    return [ prn_seq[int(ti*f_prn)%32] for ti in t]
f_prn = f_prn =  25e3/10
t=np.linspace(0,4/f_prn,400)

plt.figure(figsize=(16,6))
plt.plot(t,prn_np(t),color='red',lw=4)
plt.plot(t,signal(t),'b',lw=2)
plt.title('CDMA BPSK',size=20)
plt.xlim([0,t[-1]])
plt.ylim([-1.5,1.5])
plt.grid()


plt.xlabel('Time[s]',size=16)
f_prn = f_prn =  25e3/10
t=np.linspace(0,4/f_prn,400)

plt.figure(figsize=(16,6))
plt.plot(t,prn_np(t),color='red',lw=4)
plt.plot(t,signal(t),'b',lw=2)
plt.title('CDMA BPSK',size=20)
plt.xlim([0,t[-1]])
plt.ylim([-1.5,1.5])
plt.grid()
xt=t[-1]/32.
for i in np.arange(32):
    plt.text((i+1/2.)*xt,1.2*prn_seq[i],prn_seq[i])
plt.xlabel('Time[s]',size=16)

Jay Patel
OFI Postdoctoral Fellow in Underwater Communication Systems
My research interests include electronics & communications, distributed underwater robotics, mobile computing and programmable matter.